 AckuityRequest assessment
PRODUCT WALKTHROUGH
Inside the console. Follow the action.
See how teams discover agents, investigate activity and configure the Agent Execution Control Switch. Eight real console screens, with the context to read them.
Agent security starts with knowing what an agent can reach, what it is trying to do and which actions need a decision. This tour follows those questions through the Ackuity console.
14 categories
60+ threat models
8 console views
01 / discovery
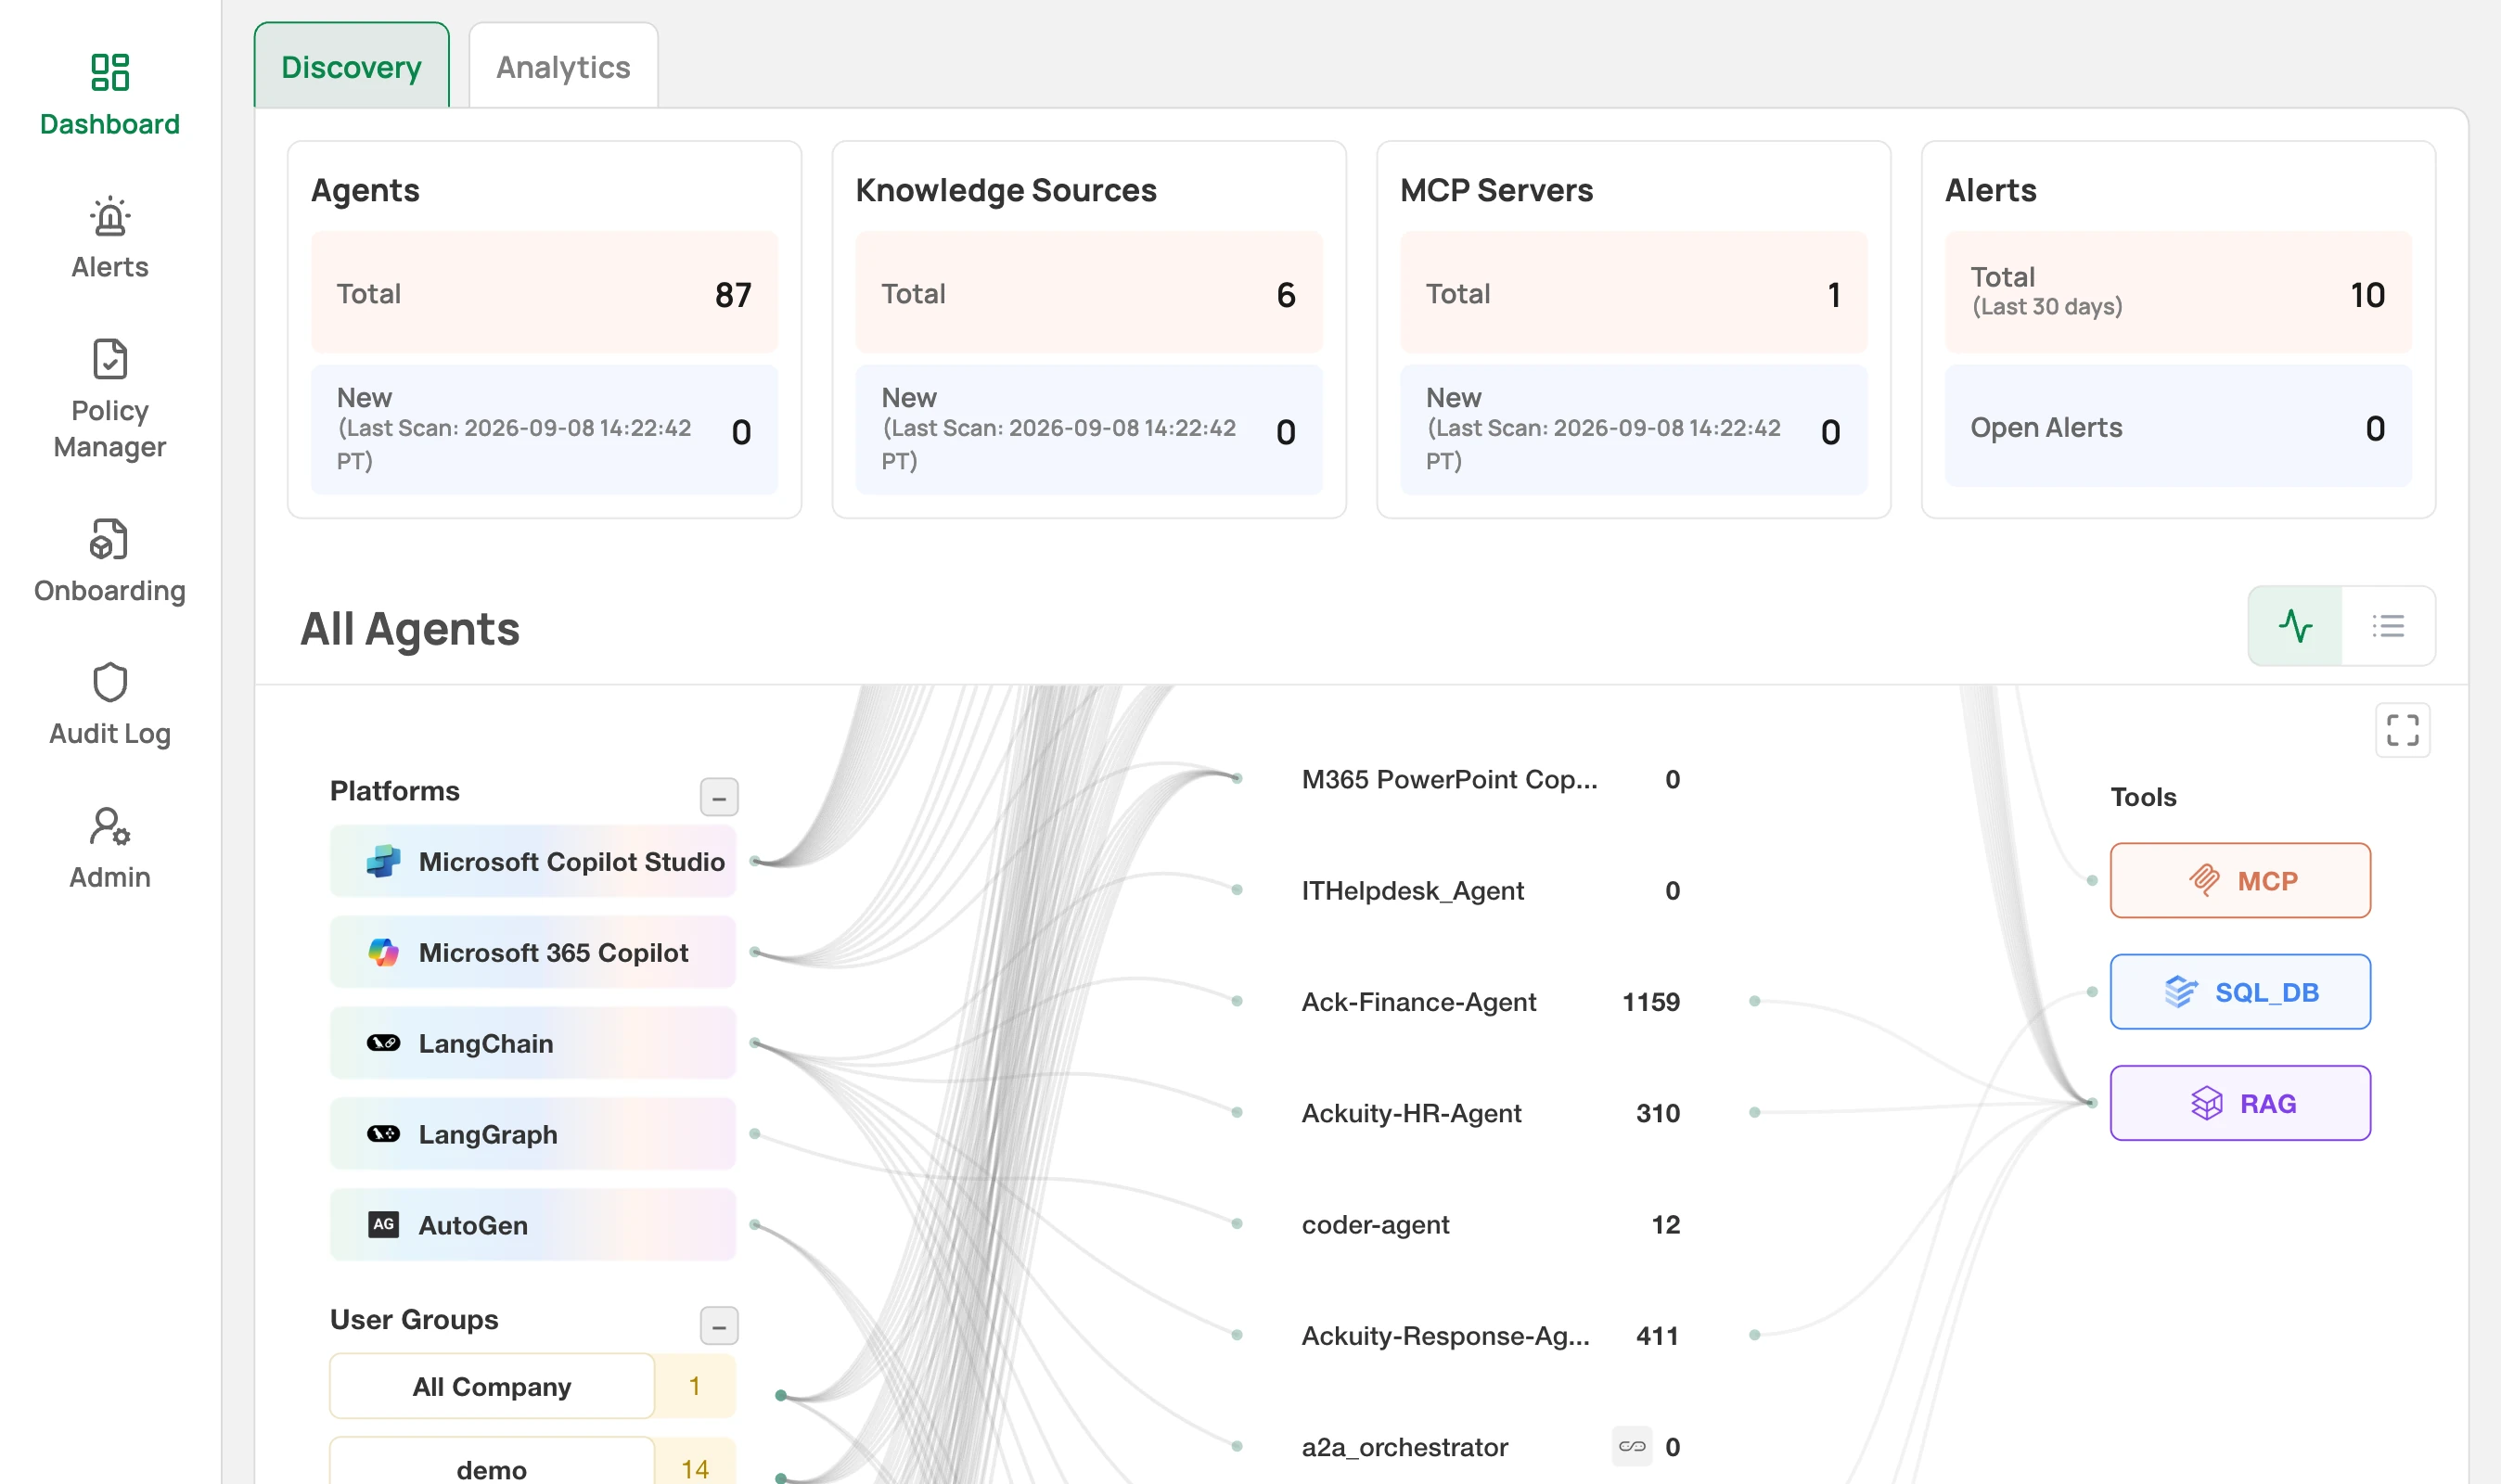
See the estate before the incident.
Start with the agents and systems your team needs to understand. The discovery view brings agents, knowledge sources and MCP servers into one place.
- Review the discovered agents and their connected resources.
- Use the inventory to decide where to investigate next.
02 / detection
Find the action worth investigating.
The alert view organizes agent activity by technique, severity and recorded status. Start with a specific event, then open the context behind it.
- Review categories such as goal drift, tool misuse and prompt extraction.
- Filter the events and export records for the investigation workflow.

03 / triage
Read the task beside the alert.
The expanded GitHub alert puts the user request, agent identity and system prompt beside the explanation. That makes the boundary easier to inspect.
- Compare the requested work with the agent’s stated objective.
- Inspect the explanation before investigating or closing the case.

04 / policy
Choose the response by threat.
Ackuity covers 14 categories and 60+ threat models. Configure how the relevant rules apply, using global defaults and per-agent overrides where supported.
- Review Block and Alert settings for the relevant threat rules.
- Separate observation from enforcement when planning rollout.

05 / compliance
Put data handling into the workflow.
The data rules view brings classifications and control settings together. Review the data types and handling choices that matter to the connected workflow.
- Inspect the available PII, PHI and SPI classifications.
- Evaluate alerting or masking against the actual response and supported integration.

06 / policy as code
Make the boundary inspectable.
The OPA Rules view exposes concrete policy examples: agent-to-agent routing, public repository creation, risky GitHub calls and cloud metadata access.
- Inspect the rule behind the operation you want to restrict.
- Pair a restricted operation with useful work that should remain allowed.

07 / deployment
Keep the control outside the agent.
The sidecar configuration view describes the certificate authority, managed certificates and interception setup for a sidecar deployment.
- Review the cluster trust setup and init-container network configuration.
- Identify the execution paths covered by the deployment before testing it.

08 / audit
Follow the record back to its context.
The audit view connects a user, an agent, a destination and a captured activity record. Use that provenance to ask what happened and which source the action used.
- Inspect the available query, knowledge source and recorded trace.
- Match the record to the target-system event for the same action.

EVALUATE THE CONTROL
Connect the decision to the outcome.
A policy card, an alert and an audit record answer different questions. To evaluate enforcement, follow the same action through the whole chain.
Requested action
Record the task, identity, operation and target, with a timestamp or request ID.
Applied decision
Identify the policy version, relevant context, verdict and enforcement mode.
Target outcome
Inspect the matching response, audit event and state. Pair it with a permitted action from the same setup.
Use the agent security test kit
For the architecture behind action context, explore the Agent Security Context Graph.
YOUR QUESTIONS, ANSWERED
Before you take the next step.
What does the Ackuity product walkthrough show?
Eight console views for discovery, detection, triage, threat policy, data rules, policy as code, sidecar configuration and audit investigation. It is a product tour, not a single continuous enforcement test.
How many threat categories and models does Ackuity cover?
Ackuity covers 14 categories and 60+ threat models. Confirm the active rule configuration and supported deployment path when evaluating a specific action.
Does a Blocked status prove the target action did not execute?
A console status is one part of the evidence. Correlate the attempted request, applied policy and decision with the matching target-system response and state.
Does the sidecar screen describe every integration?
No. It describes the sidecar route. Copilot Studio API integration and observe-only collection are separate paths; evaluate the controls supported by the integration you use.
NEXT STEP
See it on your own agents.
Start with the 30-day Agent Exposure Assessment to understand your environment and discuss the controls you need.